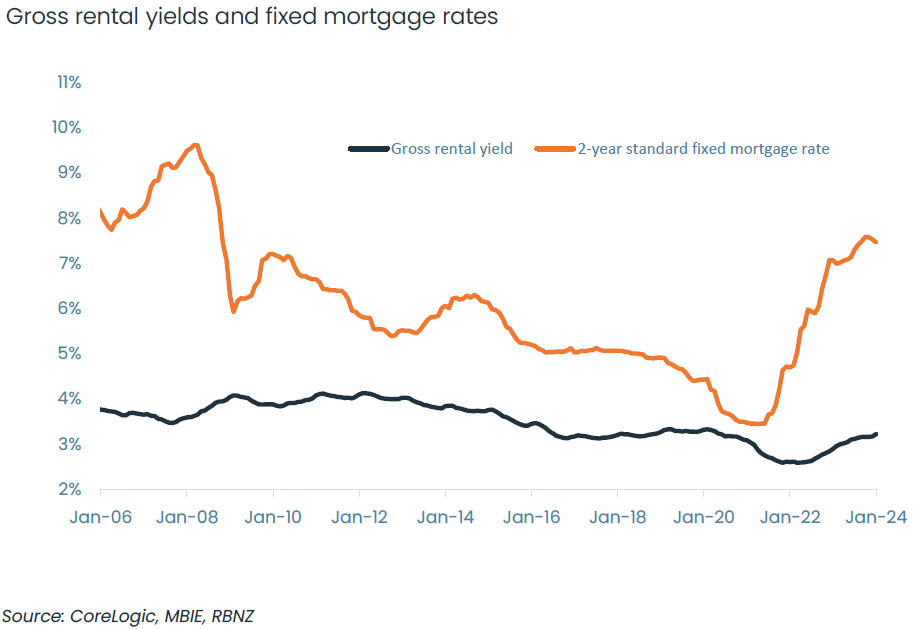
Despite record increases in rents, New Zealand property investors are grappling with a notable disparity between gross yields and mortgage repayments, requiring them to seek alternative sources of income.
The CoreLogic NZ March Housing Chart Pack shows New Zealand’s residential real estate market is worth an estimated $1.62 trillion following a monthly increase in national average values of 0.3% in February.
CoreLogic NZ Chief Property Economist Kelvin Davidson said one of this month’s most interesting insights was the disparity between gross rental yields and mortgage rates, marking the widest gap observed since 2008.
Gross rental yields nationally increased to 3.2% in February and are at the highest level since late 2020, having improved from a trough of 2.6% in 2022.
Chart of the Month

However, Mr Davidson said even with the increase, yields were still relatively low by historical standards and are less than the income returns on other asset classes such as term deposits.
“The rise in rents means yields are creeping slightly higher, but the increase is nowhere near enough to compensate for high mortgage rates,” he said.
“Our measure of yields, which is based on average property values and rents, might not necessarily represent the actual experience of all investors, especially existing owners who have held for many years. But the big-picture conclusions still hold.”
He surmised the large top-ups required from other income sources on a typical rental property purchase could mean investors might be holding off on entering the market.
“Fewer investors will result in less stock hitting the rental market than there otherwise might have been, which only adds upwards pressure on rents,” he said.
“Then again, in principle, fewer investors mean less competition and an opportunity for those renters who can save a deposit to possibly buy their own home. Certainly, our Buyer Classification data is showing first home buyers remain active.”
The yield to mortgage gap persists despite NZ’s rental growth still running at historically high levels. Rents increased 6.0% in the year to January, a growth rate that’s almost twice the long-term average of 3.2%.
“Rents are nowhere near enough to cover the mortgage for a typical debt-backed purchase in the current market, let alone other running and maintenance costs, so an investor’s cashflow needs to be supplemented from other income,” Mr Davidson said.
He also added that these top-ups will typically remain in play even after tax bills have declined due to the reinstatement of mortgage interest deductions.
"In a nutshell, it remains tricky to get the sums to stack for 'Mum and Dad' investors at present."
The chart pack also shows buyers have more choice with the number of new listings increasing in February after the traditional holiday slowdown. More stock on the market may subdue near-term price pressures.
Sales volumes were also about 19% higher than the same month last year and marked the 10th consecutive monthly increase. But it's from a low base. Over the past year, there have been 69,248 transactions, an improvement on April 2023’s trough of less than 62,000, but still well below the 10-year average of around 91,000.
Mr Davidson described the outlook for the country’s property recovery as underwhelming and ‘patchy’, with these muted conditions expected to continue in 2024, given mortgage rates remain high.
March Housing Chart Pack highlights:
- New Zealand’s residential real estate market is worth a combined $1.62 trillion.
- There was a 1.6% increase in average property values across NZ in the three months to February, on an annual basis however values fell -1.4% in the year to February. That’s the smallest annual drop since October 2022 (-0.6%).
- Property values in the country’s main urban centres and regional areas were all in positive territory in the three months to February.
- Tauranga was the strongest performing city area, with average property values increasing 2.7% in the three months to February, while within Auckland, Manukau saw a 3.5% rise.
- February sales volumes increased for the 10th consecutive month and were 19% higher than the same month last year.
- There were more than 69,000 sales in the year to February, still well below NZ’s 10-year average of more than 90,000 per year.
- There were 9,994 new listings over the four weeks ending 10th March, an increase on the same time last year but still short of the long-term average.
- Total stock on the market is up by around 6% on the same time last year.
- First home buyers’ market share of 26% remains consistently high, and there’s been an uptick in cash multiple property owner activity to 14% of buyers.
- National rental growth of 6.0% is running at historically high levels.
- Gross rental yields nationally remain at 3.2% (from a trough of 2.6% for much of 2022), the highest level since late 2020.
- Around 57% of NZ’s existing mortgages by value are currently fixed but are due to reprice onto a new (generally higher) mortgage rate over the next 12 months.
- Inflation seems to have passed its peak and the Reserve Bank will wait to see the effects of the final 5.5% OCR for this tightening cycle.
Download the Housing Chart Pack