Overview
CoreLogic’s Monthly Housing Chart Pack uses detailed charts on the need-to-know market metrics such as property values, sales volumes, buyer market share, and rental growth.
This is a one-stop shop for property and finance professionals as well as those interested in residential real estate, who want a complete overview of the New Zealand housing market.
In the monthly chart pack, you’ll find a series of graphics and data showing how the housing market has performed each month.
Download the free report
What is included?

Value of assets
The report summarises key New Zealand asset classes and looks at how residential real estate compares to other mainstream investments.

Market insights
You can find commentary and analysis of the monthly index movements within the charts. This information allows for quality market analysis across city and regional markets and is the on

Range of Metrics
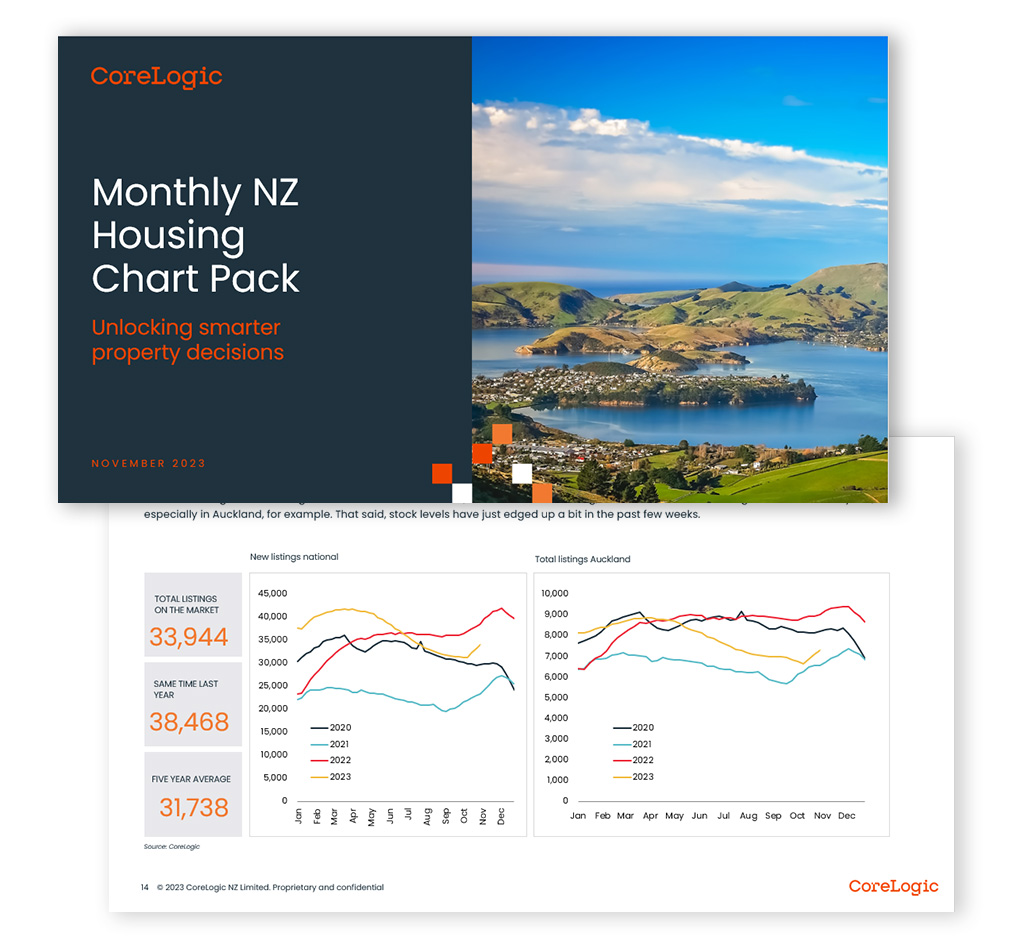
A 360-degree view of the property market including national sales, numbers of listings, rental yield, and rental price movements.