CoreLogic's House Price Index (HPI), which is the most robust measure of property value change in the market, shows the NZ property market has weakened further as the power shifts to buyers.
The national measure of housing prices flattened out in March (0.7%), a further drop from the February reading of 0.8% and the lowest monthly rate of change since the weakness which followed the initial COVID enforced nationwide lockdown in August 2020.
CoreLogic House Price Index - National and Main Centres
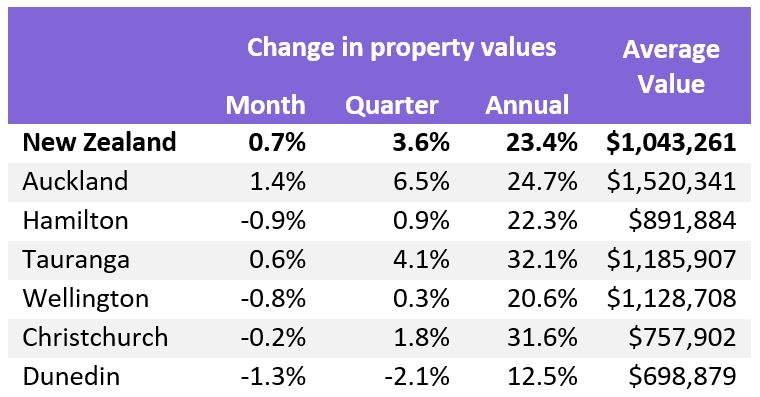
Each of the main centres saw a drop in prices or a reduction in the monthly, quarterly and annual rate of growth. The reversal in price growth looks the greatest in Dunedin, where values fell by -1.3% over March – the largest monthly decline since February 2009. The annual rate of growth dropped to 12.5%, which is well down on the peak rate of growth achieved only six months ago of 23.2% (October 2021).
Hamilton and Wellington have also seen a shift in market direction with values down -0.9% and -0.8% respectively.
Meanwhile Christchurch values appear to have plateaued (-0.2%) after the recent annual rate of growth peaked at 38.0% at the end of 2021. The annual rate of growth at the end of March 2022 has moderated to 31.6% which is still high in both historical context and compared to the other main centres.
Tauranga also has a relatively high annual growth rate (32.1%), with a further 0.6% growth in the market over March. The greater prevalence of ‘next home buyers' may be a reason for the extended period of growth in Tauranga.
Auckland's annual rate of growth is lower than both of these areas (24.7%), however the monthly rate of growth was the strongest of the six main centres at 1.4%. There are variances showing up beneath the surface though, with the southern parts of Auckland appearing weaker than the rest (Manukau -0.3%, Papakura +0.1% and Franklin -0.9%).
Meanwhile Auckland City and the more rural Rodney areas saw continued growth (2.6% and 2.3% respectively).
CoreLogic NZ Head of Research Nick Goodall says "After such a significant upswing in values, some of the areas which saw the greatest deterioration in affordability are now also at risk of the greatest vulnerability. The impact of tightening credit and increasing interest rates has reduced the pool of buyers who are willing and able to pay recent prices and this has led to a reduced number of property transactions.”
Preliminary sales figures for March suggest the month should end with roughly 7,000-7,500 sales once the full population of transactions flows through. This would be a lift on February, which is seasonally normal, but about -10-20% below the long-term average for March.
Mr Goodall says "As properties stay on the market longer and expectations of weaker conditions ahead grow, buyers are finding themselves in a stronger negotiation position, with more time and leverage than at any stage in the last couple of years. Stories of ‘bargain hunters' and ‘cheeky offers' are becoming more prevalent. This switch of power to the buyer came sooner than most were expecting and will vary around the country.”
CoreLogic House Price Index – Main Urban Areas (ordered by annual growth)
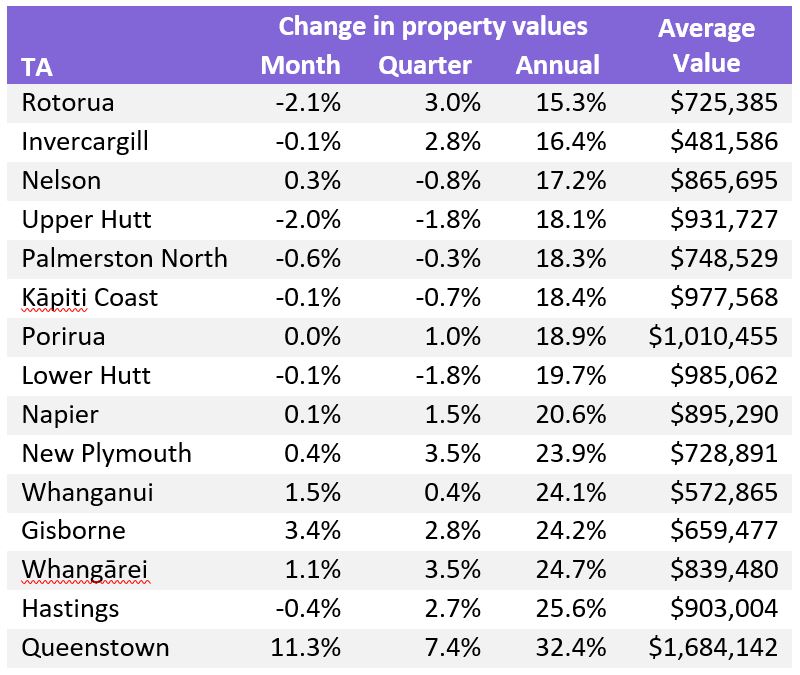
The trend across the other main urban areas is also one of growing weakness. Monthly results are slightly mixed and inconsistent month-to-month, which is a clear sign of change. Queenstown's market appears to be very volatile as transactions dry up but some sales still do well.
Rotorua and Upper Hutt in particular saw values weaken over March (-2.1% and -2.0% respectively), while Gisborne values mini-surged 3.4% over the month. Most other areas saw very minor falls or very slight growth (between -0.6% and +0.4%).
"Much of the concern for future vulnerability is for the equity position, and ability for recent home buyers, and in particular first home buyers, to pay higher mortgage repayments,” says Mr Goodall.
"The increases in interest rates over the past nine months are a key reason for this, with most terms now more than 1.5 percentage points higher than their low point. Anyone negotiating that in their budget could be looking at an extra $40 per fortnight for every $100,000 in debt they're refixing. Assuming 50/50 split terms on the average mortgage ($550k according to the RBNZ) and that could mean an extra $100 per week in mortgage repayments, on top of high inflation which has caused the current cost of living crisis.
"But it should also be acknowledged that bank serviceability tests exist to help prepare borrowers for this eventuation and deposit requirements mean the majority should have 20% equity to help guard against the potential for falling home prices. Given recent growth too, a 10% fall in prices would take them back to the level of July last year, while a 20% fall simply back to a year ago. No one is forecasting a 20% drop in property prices, while it's also important to note that the largest peak to trough fall in national average values in recent history was ‘only' 10% in the GFC (more below).”
Meanwhile a recently published analysis from the Reserve Bank of Australia (RBA) found that while first home buyers were at greater risk than other buyers due to their lower equity position, this cohort showed lower rates of mortgage arrears over time and their ability to withstand an economic downturn was greater as they have better job security and a faster future earnings potential. This analysis is likely to be just as applicable to the NZ market as Australia.
Mr Goodall says "Perhaps that is the key potential swing factor for the market this year – the economy and with it the labour market. If unemployment stays anywhere near as low as it currently is, then the likelihood of motivated or forced sales should remain low, helping to guard against a severe downturn.
"Nonetheless a look back in history is useful to provide some context of what might happen next. While the market settings and backdrop for the downturn which followed the GFC are very different to now, it is an interesting recent example of what can happen when credit is persistently constrained.
"The total fall in value of 10% from peak (Oct 2007) to trough (Feb 2009) is relatively well publicised but the length of the downturn is not. In total it took 5 years (from October 2007 to September 2012) for property values to get back to parity with the pre-GFC peak, so perhaps the risk is not so much for a large scale drop, but expectations should probably be tempered for how long it takes the market to stage a nominal recovery.”
Property investors are already a group that has to be more considered about making the finances work, with reduced tax advantages and tighter lending restrictions. Combined with reduced short-term capital growth on offer, demand from this sector may further reduce.
Mr Goodall says "Of course, this is all assuming credit settings remain as tight as they are, and that seems unlikely. We've already seen a significant drop in loans being advanced as a result of the tightened loan to value ratio (LVR) limits, on top of the changes to the Credit Contracts and Consumer Finance Act (CCCFA).
”But the CCCFA will soon be relaxed and the banks have shot way below the LVR limits so have a little room to open back up. We're now hearing pre-approvals are being looked at again and banks have also started to relax their self-imposed DTI caps, so perhaps we'll look back on the first quarter of 2022 as the tightest it ever got.
Enquire about the CoreLogic House Price Index, request a copy of the latest data or subscribe to future updates here.
CoreLogic New Zealand