As New Zealand’s property market shows a modest recovery in sales volumes, the broader picture indicates activity remains subdued, with listings at elevated levels and prices flattening off.
The CoreLogic NZ June Housing Chart Pack shows that despite a 9.2% annual increase in sales activity in May, the country’s property market faces persistent challenges, with total sales significantly below normal levels and house prices levelling out again.
Sales activity on the rise, slowly
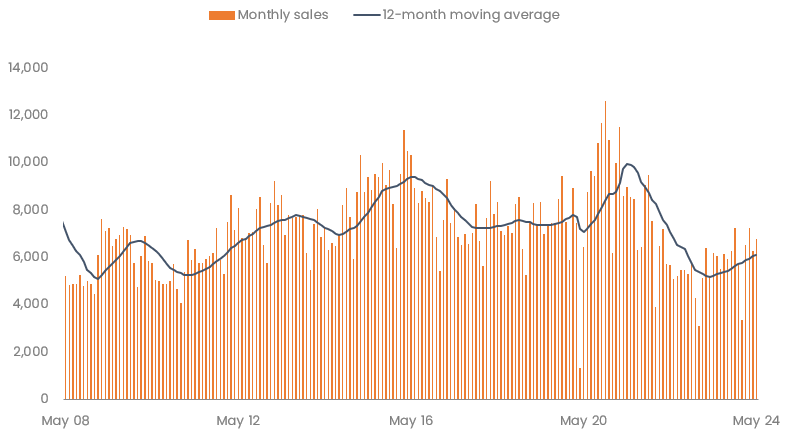
Monthly sales with 12-month moving average, national
CoreLogic NZ Chief Property Economist Kelvin Davidson said sales activity increased for the 13th consecutive month in May to 6,789 transactions, however the number of deals being done among estate agents and in private deals remained subdued.
“At 73,181 deals in the past 12 months, sales are still a long way below the normal levels of about 90,000 per year.
Mr Davidson said this was evident in the latest CoreLogic House Price Index (HPI), which has edged lower for the past two months, with Auckland down by 0.8% in May, Wellington by 0.6%, and Tauranga 0.5%.
“However, some areas did see a price increase in May. Overall, this suggests a broad flattening of prices across the market,” he said.
Total stock is 15.8% higher than the same time last year and 27.6% higher than the five-year average.
“New listings activity has been solid although not spectacular so far in 2024, and it would appear that some ‘pent up’ reluctance to list in the final few months of last year is now coming forward and turning into available stock this year,” Mr Davidson said.
“Sales activity also remains a little muted, and this combination is creating more choice for buyers. It wouldn’t be a surprise to see listings continue to flow pretty nicely in the coming months, especially if the shorter Brightline Test from 1st July prompts some investors to sell.”
Buyer dynamics
First home buyers (FHBs) continue to represent a 25% share of purchases as they enjoy lower house prices, less competition from other buyer groups, leverage KiwiSaver for the deposit, as well as access to low-deposit finance at the banks.
At around 26%, relocating owner-occupiers (‘movers’) have also maintained a stable market share for the past 18 months, but are starting to show signs of a small comeback, possibly due to some pent-up demand to move.
Mr Davidson said tracking this buyer segment over the remainder of the year would be an important indicator of underlying demand, market stability and confidence in the economy.
Regulatory changes and impact on outlook
Regulation and rule changes remain a key theme in New Zealand’s property market. >First home grants have been scrapped, debt to income ratio caps will come into effect on 1 July, and loan-to-value-ratio (LVR) rules are set to loosen from the same date.
“In an environment where mortgage rates remain high and aren’t set to fall materially for a while yet, this year remains pretty underwhelming for the property market, despite a raft of policy changes,” he said.
Mr Davidson said the market’s recovery over 2023 was largely due to a resilient labour market and strong net migration, which has now passed its peak.
“The more recent loss of momentum is a reflection of prolonged affordability pressures, persistent high mortgage rates, an increase in listings on the market, and a turning point for unemployment,” he said.
June Housing Chart Pack highlights:
- New Zealand’s residential real estate market is worth a combined $1.63 trillion.
- There was a 1.0% increase in average property values across NZ in the 12 months to May, the ‘strongest’ annual increase since 2.8% in the year to September 2022.
- Dunedin and Hamilton were the strongest performing main centres increasing 2.1% and 1.0% respectively in the three months to May, while Manukau and Papakura within Auckland were the weakest markets across the quarter, falling 2.6% and 2.4% respectively.
- May sales volumes increased for the 13th consecutive month and were 9.2% higher than the same month in 2023.
- There were 73,181 sales in the year to May, still well below NZ’s longer term average of about 90,000 per year.
- There were 7,000 new listings over the four weeks ending 2nd June.
- Total stock on the market is 21,784, a 15.8% increase on the same time last year and 27.6% higher than the five-year average.
- National rental growth has slowed to 3.8% in the year to May
- Gross rental yields nationally remain at 3.2% (from a trough of 2.6% for much of 2022), the highest level since late 2020.
- Around 62% of NZ’s existing mortgages by value are currently fixed but are due to reprice onto a new (generally higher) mortgage rate over the next 12 months.
- Inflation has passed its peak and the Reserve Bank will wait to see the effects of the final 5.5% OCR for this tightening cycle.
Download the June Housing Chart Pack
