Each month the CoreLogic Research team puts together a Housing Chart Pack, with all the latest stats, facts and figures on the residential property market, such as the combined value of residential real estate, sales and listings, buyer classification, rents, credit conditions and more.
Here is this month's Executive Summary:
- Property sales volumes showed solid increases in May and June, but the latest figures for July were more sluggish again. This shouldn’t come as too much surprise, given that some key market drivers have turned, but also that challenges remain.
- A really good case in point is mortgage rates. Yes, they might have broadly stopped rising. But with the official cash rate not set to be cut for some time yet, mortgage rates aren’t likely to fall much anytime soon either.
- Turning to property values, again, the results are ‘patchy’ - the signs of a floor are slowly emerging in some areas, but it’s not widespread yet. For example, parts of Auckland and Wellington showed increases in values in July, but other areas of the country have seen further declines.
- Buyer Classification data showed ‘more of the same’ in July, with first home buyers and cash multiple property owners (MPOs, including investors) retaining a strong presence, but movers and mortgaged MPOs quieter by their own standards.
- In terms of the groups to watch in the coming months, however, mortgaged MPOs could be intriguing. Rental yields remain low and mortgage rates high, meaning that an average new property investment will tend to be cashflow negative, even if interest deductibility is eventually reinstated by a potential National(-led) Government.
- But the ability to claim interest deductibility again could still drive a mindset shift amongst investors, and bring forward some more purchases again as would any reduction in the Brightline Test (although that might also drive some sales, as more existing investors would then be off the hook for capital gains tax).
- All in all, the floor for the market now seems to have arrived, more or less with migration still high and the labour market strong. But a plateau for mortgage rates and potential caps on debt to income ratios next year highlight the challenges.
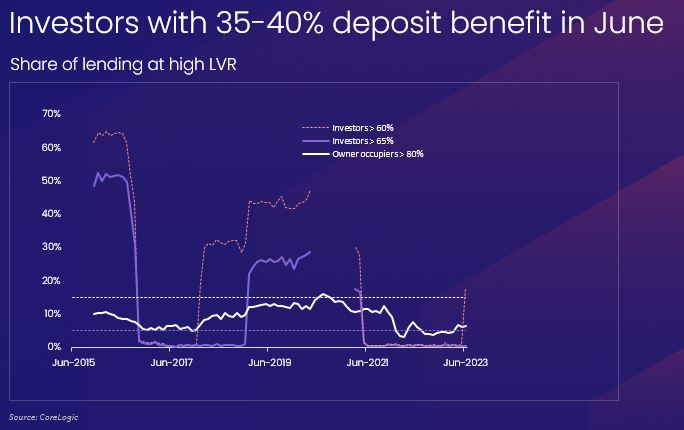
Chart of the month
Download the Monthly Housing Chart Pack
CoreLogic New Zealand