In this Market Pulse, Chief Property Economist Kelvin Davidson explores five things to know about the NZ property market that are lesser-known, but important when gauging market conditions today.
The housing market remains a hot topic in NZ, with values now falling pretty much everywhere, with property owners starting to see a bit of their ‘paper’ gain be unwound over recent months. In such conditions, i.e. at a turning point, where trends in the data become ‘patchy’, the interpretation of the figures themselves can also become a little distorted too, with some really key points sometimes overlooked. Based on our general discussions with clients, media, industry and the wider community over the past few weeks, here are five things we think don’t quite get the recognition that they should, and need to be reinforced. Of course, we’re certainly guilty of overlooking some things too! But for now, did you know…
1. The number of loans being written is ultra-low
You might have looked at the latest Reserve Bank mortgage lending figures and concluded that (despite strict deposit rules, tight expense scrutiny, and higher interest rates) they weren’t a disaster – e.g. the value of loan activity in March was $7.3bn, down from a year ago ($10.5bn), but well above March 2020’s figure ($6.2bn).
But when property values have risen so much, the average loan size tends to increase too, and hence total lending flows as well. Indeed, if you look at the number of loans drawn-down in March (across more than just sales; also including things like top-ups and refinancing), it was actually the weakest figure for that month of the year since at least 2015. And taking January to March combined, total loans of 45,298 were significantly (-37%) below the average for that same three-month period over 2015-2021 of 72,370 (see the first chart).

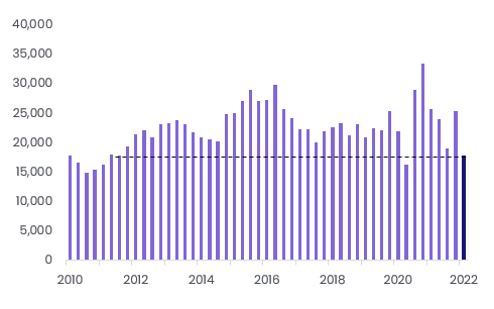
2. The rise in listings on the market has not reflected a surge in people wanting to sell
Meanwhile, there seems to be a perception that would-be sellers are flooding the market, and this is pushing up the choice for buyers, leading to weaker price pressures. However, although there are always exceptions to the rule, it’s generally the case that actually the rise in stock on the market has simply reflected a relatively typical flow of new listings (if not even a bit below normal for the time of year) but a sharp drop in agreed sales at the other end of the pipeline. Indeed, apart from lockdown-affected Q2 2020, total sales over January to March this year have been the lowest for any quarter since Q3 2011 (see the second chart).
Admittedly, once we get through Winter (always a quiet time for activity), there’s a chance of a sharper than normal pick up in new listings, perhaps as some investors look to cut out a bit of debt, in response to regulatory changes and the removal of interest deductibility. But there are few signs of that happening just yet.
3. The total loan to value ratio for the market as a whole is actually quite low
Clearly, recent buyers using a mortgage will have mostly been taking out loans based on a fairly small deposit, or in other words a loan to value ratio of 80% (or as close to that as their bank will allow). Accordingly, this is where a lot of the risk in the market lies, especially if they also took out a mortgage at a high multiple to their income, and interest rates continue to rise and/or unemployment starts to increase. But when you look at the estimated total value of all dwellings across NZ of roughly $1.7trn, and then consider total mortgage debt of around $335bn, it’s an aggregate LVR of only about 19% – in other words, there are a lot of property owners out there with a lot of equity too (at least on paper). Back in 2018, the aggregate LVR was around 23%.
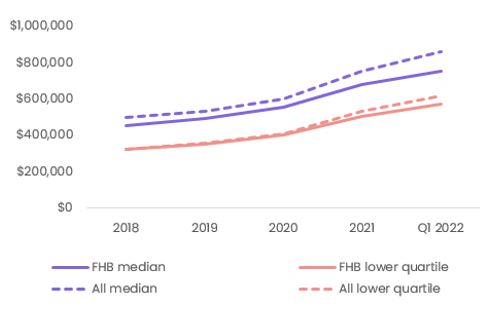
4. First home buyers don’t always enter at the bottom rung
The casual assumption that’s often made about first home buyers (FHBs) is that they ‘start at the bottom’ and slowly work their way up through the different tiers/quality of property. But this is not the case in reality. Sure, in recent years they’ve purchased relatively fewer standalone houses and more flats/apartments, which gives access to lower prices. However, the median price paid by FHBs has still stuck comfortably above the lower quartile (bottom 25%) for all buyers – in Q1 2022, FHBs paid a median of around $750,000, higher than the all-buyer lower quartile of $615,000 (see the third chart).
The latest insights on FHB market activity is available here.
5. New dwelling consents are not the same as more housing stock
For several months now, new dwelling consents around most parts of the country have been pushing up to record highs, and this is eating into our accumulated shortfalls (at affordable prices) of housing. But not all new dwelling consents will result in a finished house, and not only that, as infill development gathers speed, we’re also knocking down existing older properties to allow for the new construction. In other words, the stock of houses (and its composition) – which is what truly matters for affordability – isn’t changing as rapidly.
Indeed, if you take the fact that we had about 39,400 new dwelling consents in 2020, and then allow a 15-18 month lag to actually get those houses built, our data suggests that the housing stock has perhaps only changed by 25,900 as a result of those consents.
For the latest insights weekly, tune in or subscribe to The NZ Property Market Podcast hosted by Nick Goodall and Kelvin Davidson via Spotify or Apple Podcasts.
CoreLogic New Zealand