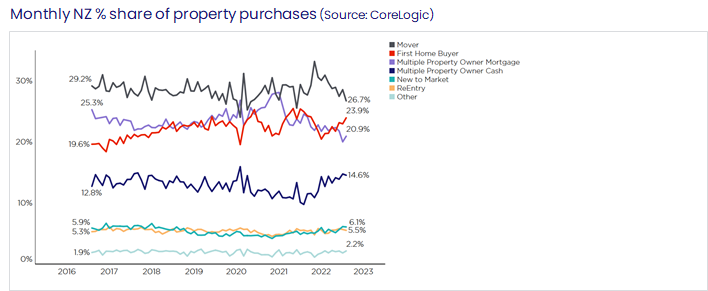
The latest CoreLogic Buyer Classification data shows continued struggles for mortgaged multiple property owners, but a relatively high % share of purchases by their cash cousins.
Broken down by size, it’s the smaller players that drove up mortgaged MPOs’ overall market share in the initial post-COVID burst, but they’re also now accounting for the weakness.
Mortgaged multiple property owners (MPOs, including investors) have been in the firing line lately, as Government/Reserve Bank regulation has ramped up, and the simple economics of being a landlord have also turned against them. These hurdles have included ring-fencing of tax losses, the extension of the Brightline Test, the removal of interest deductibility, the 40% deposit requirement, and then the sharply widening gap between gross rental yields (low) and mortgage rates (high) – meaning that ‘top ups’ are almost inevitable for anybody making a new purchase lately.
Given all of that, it’s no surprise that our data has shown a low % market share of purchases for mortgaged MPOs lately (see the first chart) – and on top of that, it’s a low share in a quiet market*.
On the flipside, cash MPOs have been enjoying conditions, with their market share currently hovering at a relatively high level. To be fair, some of these purchases won’t be cash per se, rather they’re likely to have involved the reshuffling (increasing) of debt on other properties in a portfolio, in order to free up the equity for the latest purchase. Even so, it still stands to reason that, in the current environment of expensive and restricted credit, cash buyers would be seeing opportunities.
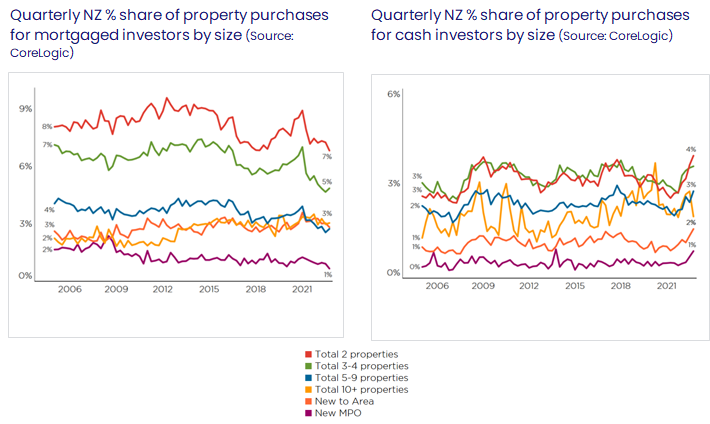
But what about the breakdown of investors’ purchasing activity by size? The second chart (overleaf) shows the overall market shares for mortgaged MPOs by number of properties owned after their latest purchase. In other words, MPO 2 are essentially new investors – in most cases, owning their own home and just recently buying their first rental.
As can be seen, the spike in overall investor activity post-COVID was driven by smaller players, i.e., the MPO 2’s and 3-4’s. However, since early 2021, their market shares have been sliding lower, as well as MPO 5-9 to some degree too**. This all seems logical – the ‘newbie’ investors probably had the most anxiety about all of the regulatory changes being pushed through, as well as probably having less equity behind them, and also a greater eye on alternative ‘safer’ investments (such as term deposits, which are again starting to pay better returns).
* Just a couple of important side notes though. First, existing investors aren’t selling to any great degree. And second, new builds are of course still a target for investors, given favourable deposit and tax treatment.
** That said, the slight caveat is that although MPO 2’ have fallen quite sharply, they started higher, and are still comparable to past troughs. By contrast, MPO 3-4, for example, are below previous troughs.
By contrast, as the third chart shows, apart from the really large buyers (MPO 10+), the cash investor groups have pretty much raised their market share lately across the board – although just be careful of the scale (the increased even for MPO 2 has only been 1%-point, from 3% in mid-2021 to 4% now).
With credit conditions set to remain testing for a while yet – especially with formal caps on debt-to-income ratios now needing to be added to medium-term considerations – cash MPOs may well hold on to a decent market share in 2023 (albeit we also expect the number of property sales to stay fairly low). The converse is that the percentage share for mortgaged MPOs looks set to continue to struggle into 2023 – although it also needs to be acknowledged that some would-be investors will have actively chosen to pull back, with the aim of buying something cheaper later. That time could well be 2023, if they can navigate the mortgage hurdles.
One final point (albeit something to jot down in the diary for a few years away yet) – given the flurry of investor purchases in the 12 to 18 months after COVID first hit (with large capital gains subsequently accruing), and the fact these purchases had a five-year Brightline period, watch for some kind of potential sell-off in 2025-26.

Meet Kelvin Davidson
Chief Economist
Kelvin joined CoreLogic in March 2018 as Senior Research Analyst, before moving into his current role of Chief Economist. He brings with him a wealth of experience, having spent 15 years working largely in private sector economic consultancies in both New Zealand and the UK.
Full profile